
Throughout my career, I've been tasked with leading brands and companies from both the strategic and creative side of their organization. As a data driven creative, I often develop ways to visualize the creative and strategic output we've created to help commercialize my ideas internally. Here are a few instances where the strategy, media and creative all came together to create something beautiful.
(all documents, animations, designs and strategies created exclusively by Colin Glaum)
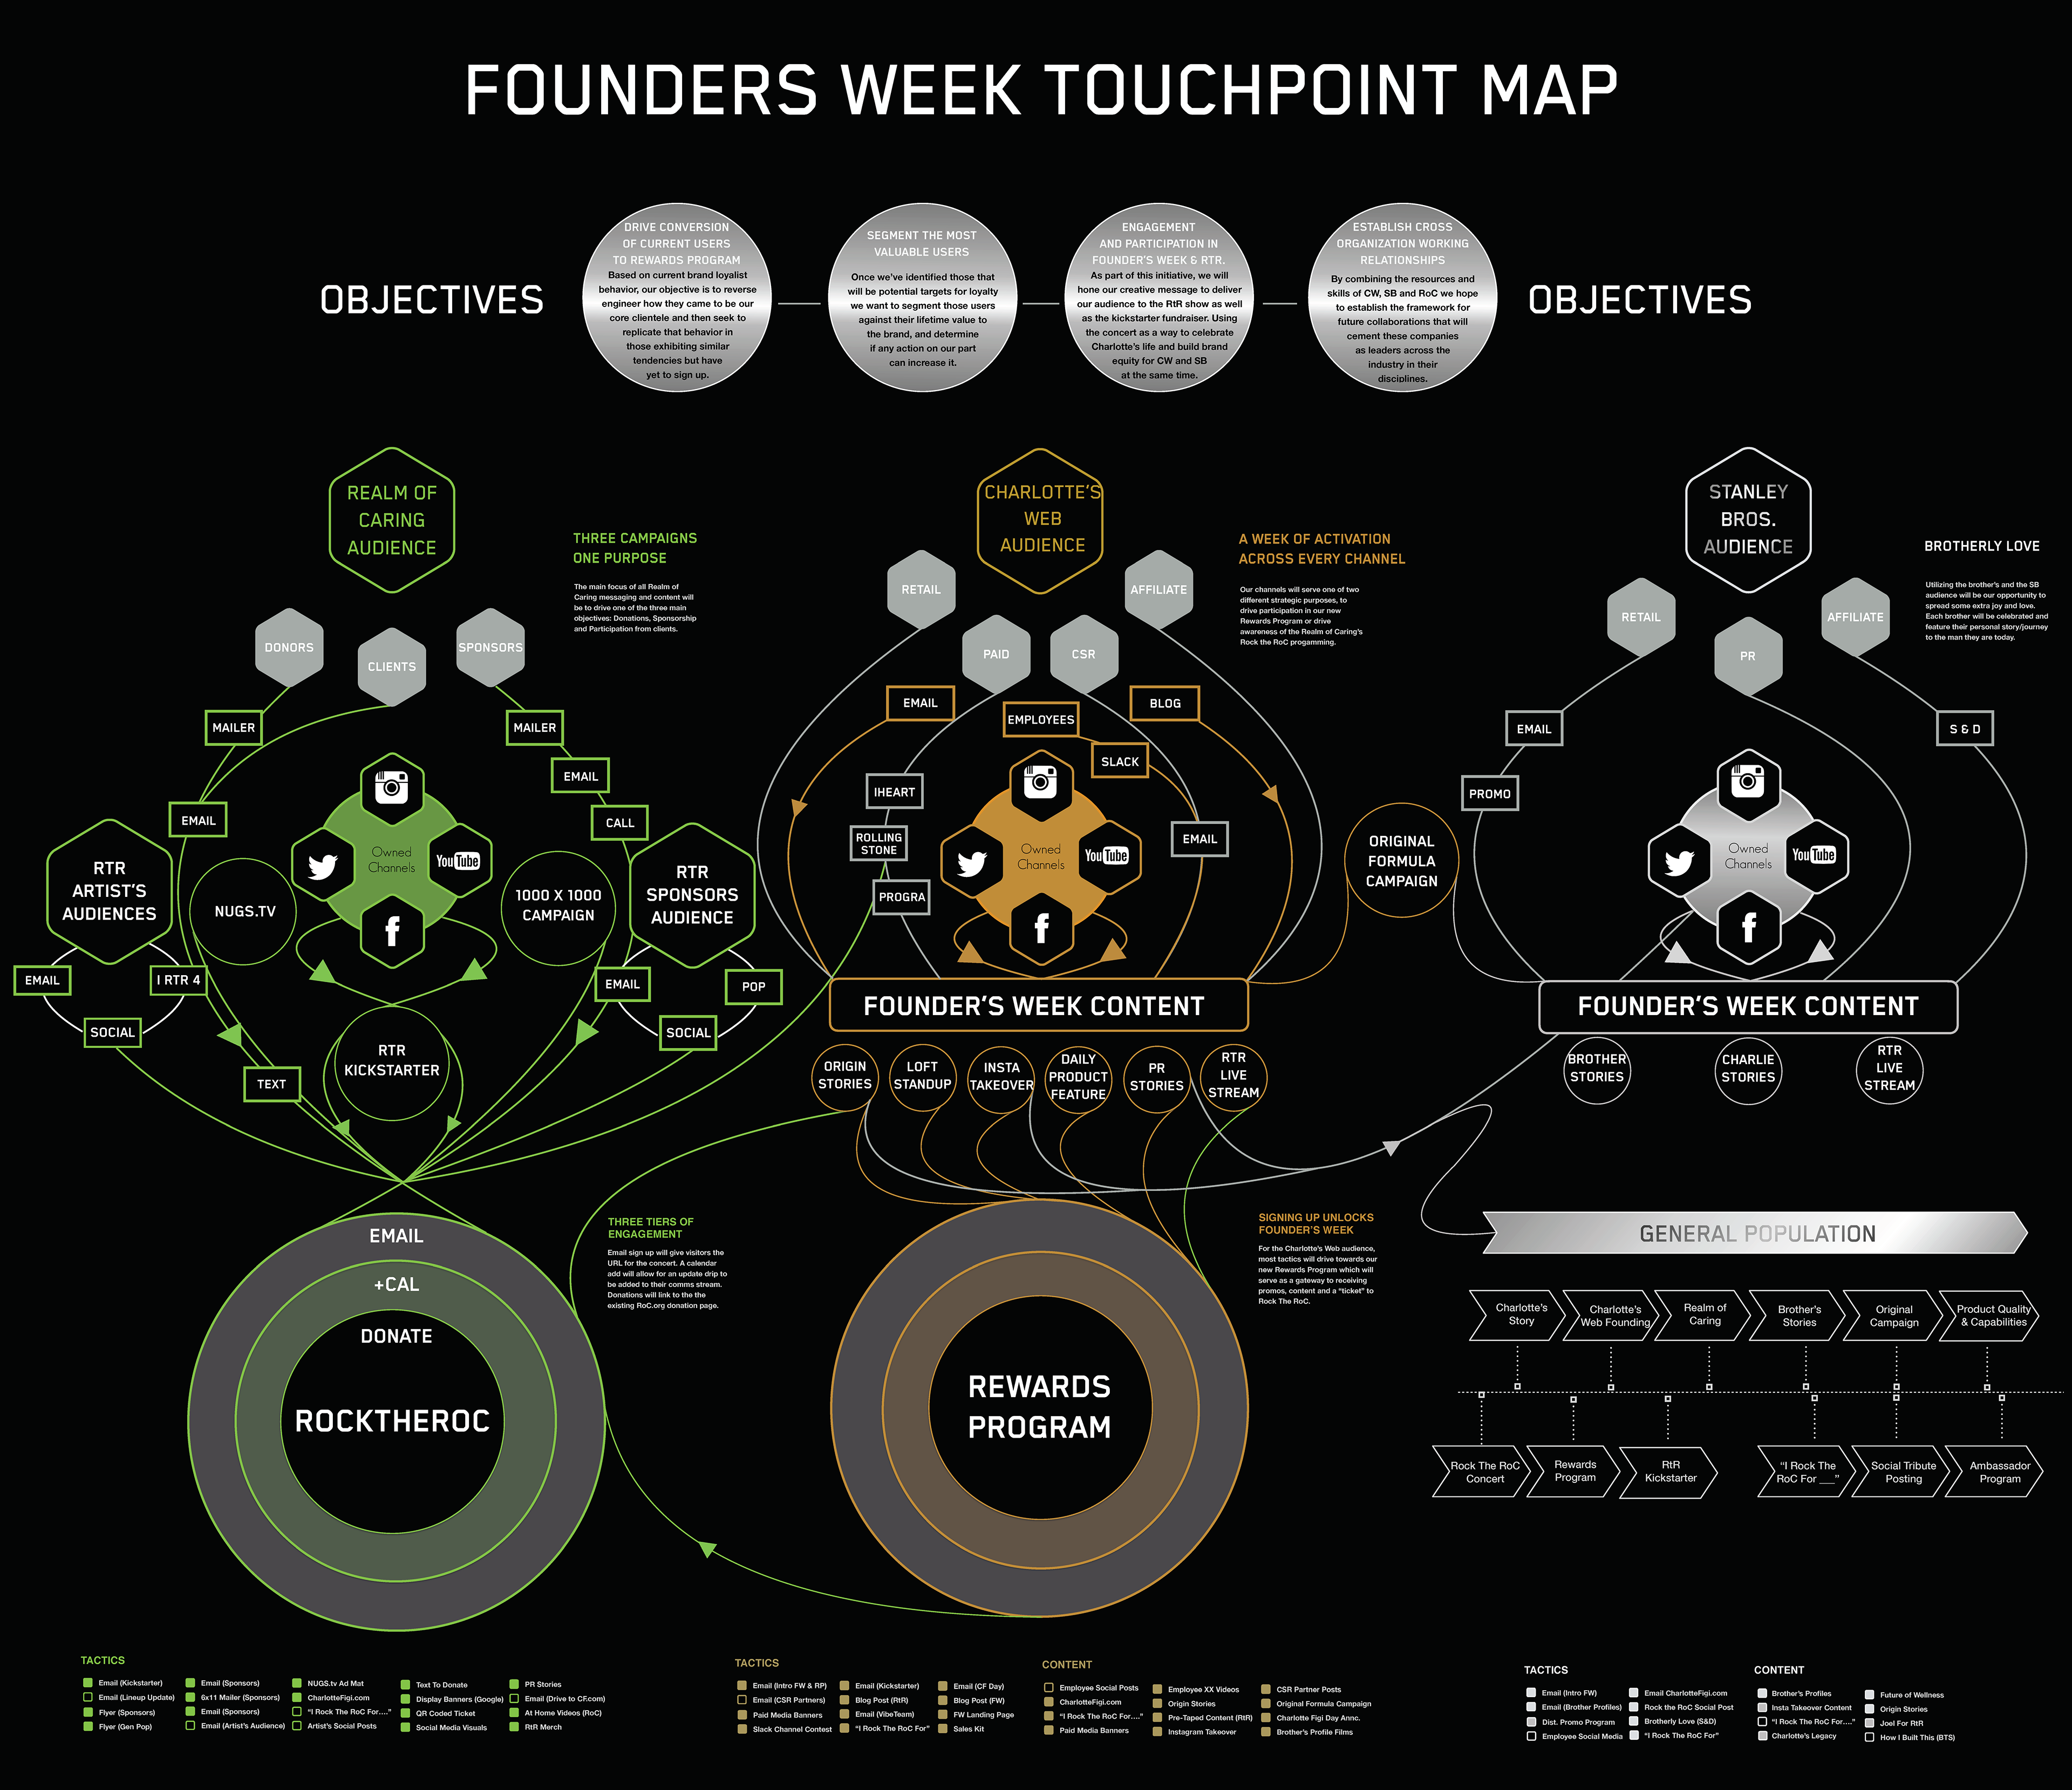
Founder's Week was a celebration of the life of Charlotte's Web's namesake, Charlotte Figi who passed of COVID. This map outlines all touchpoints addressing each of the organizations involved in the celebration, how they all worked together to elevate the legacy and story of Charlotte and ultimately how we were tracking ROI for the program.
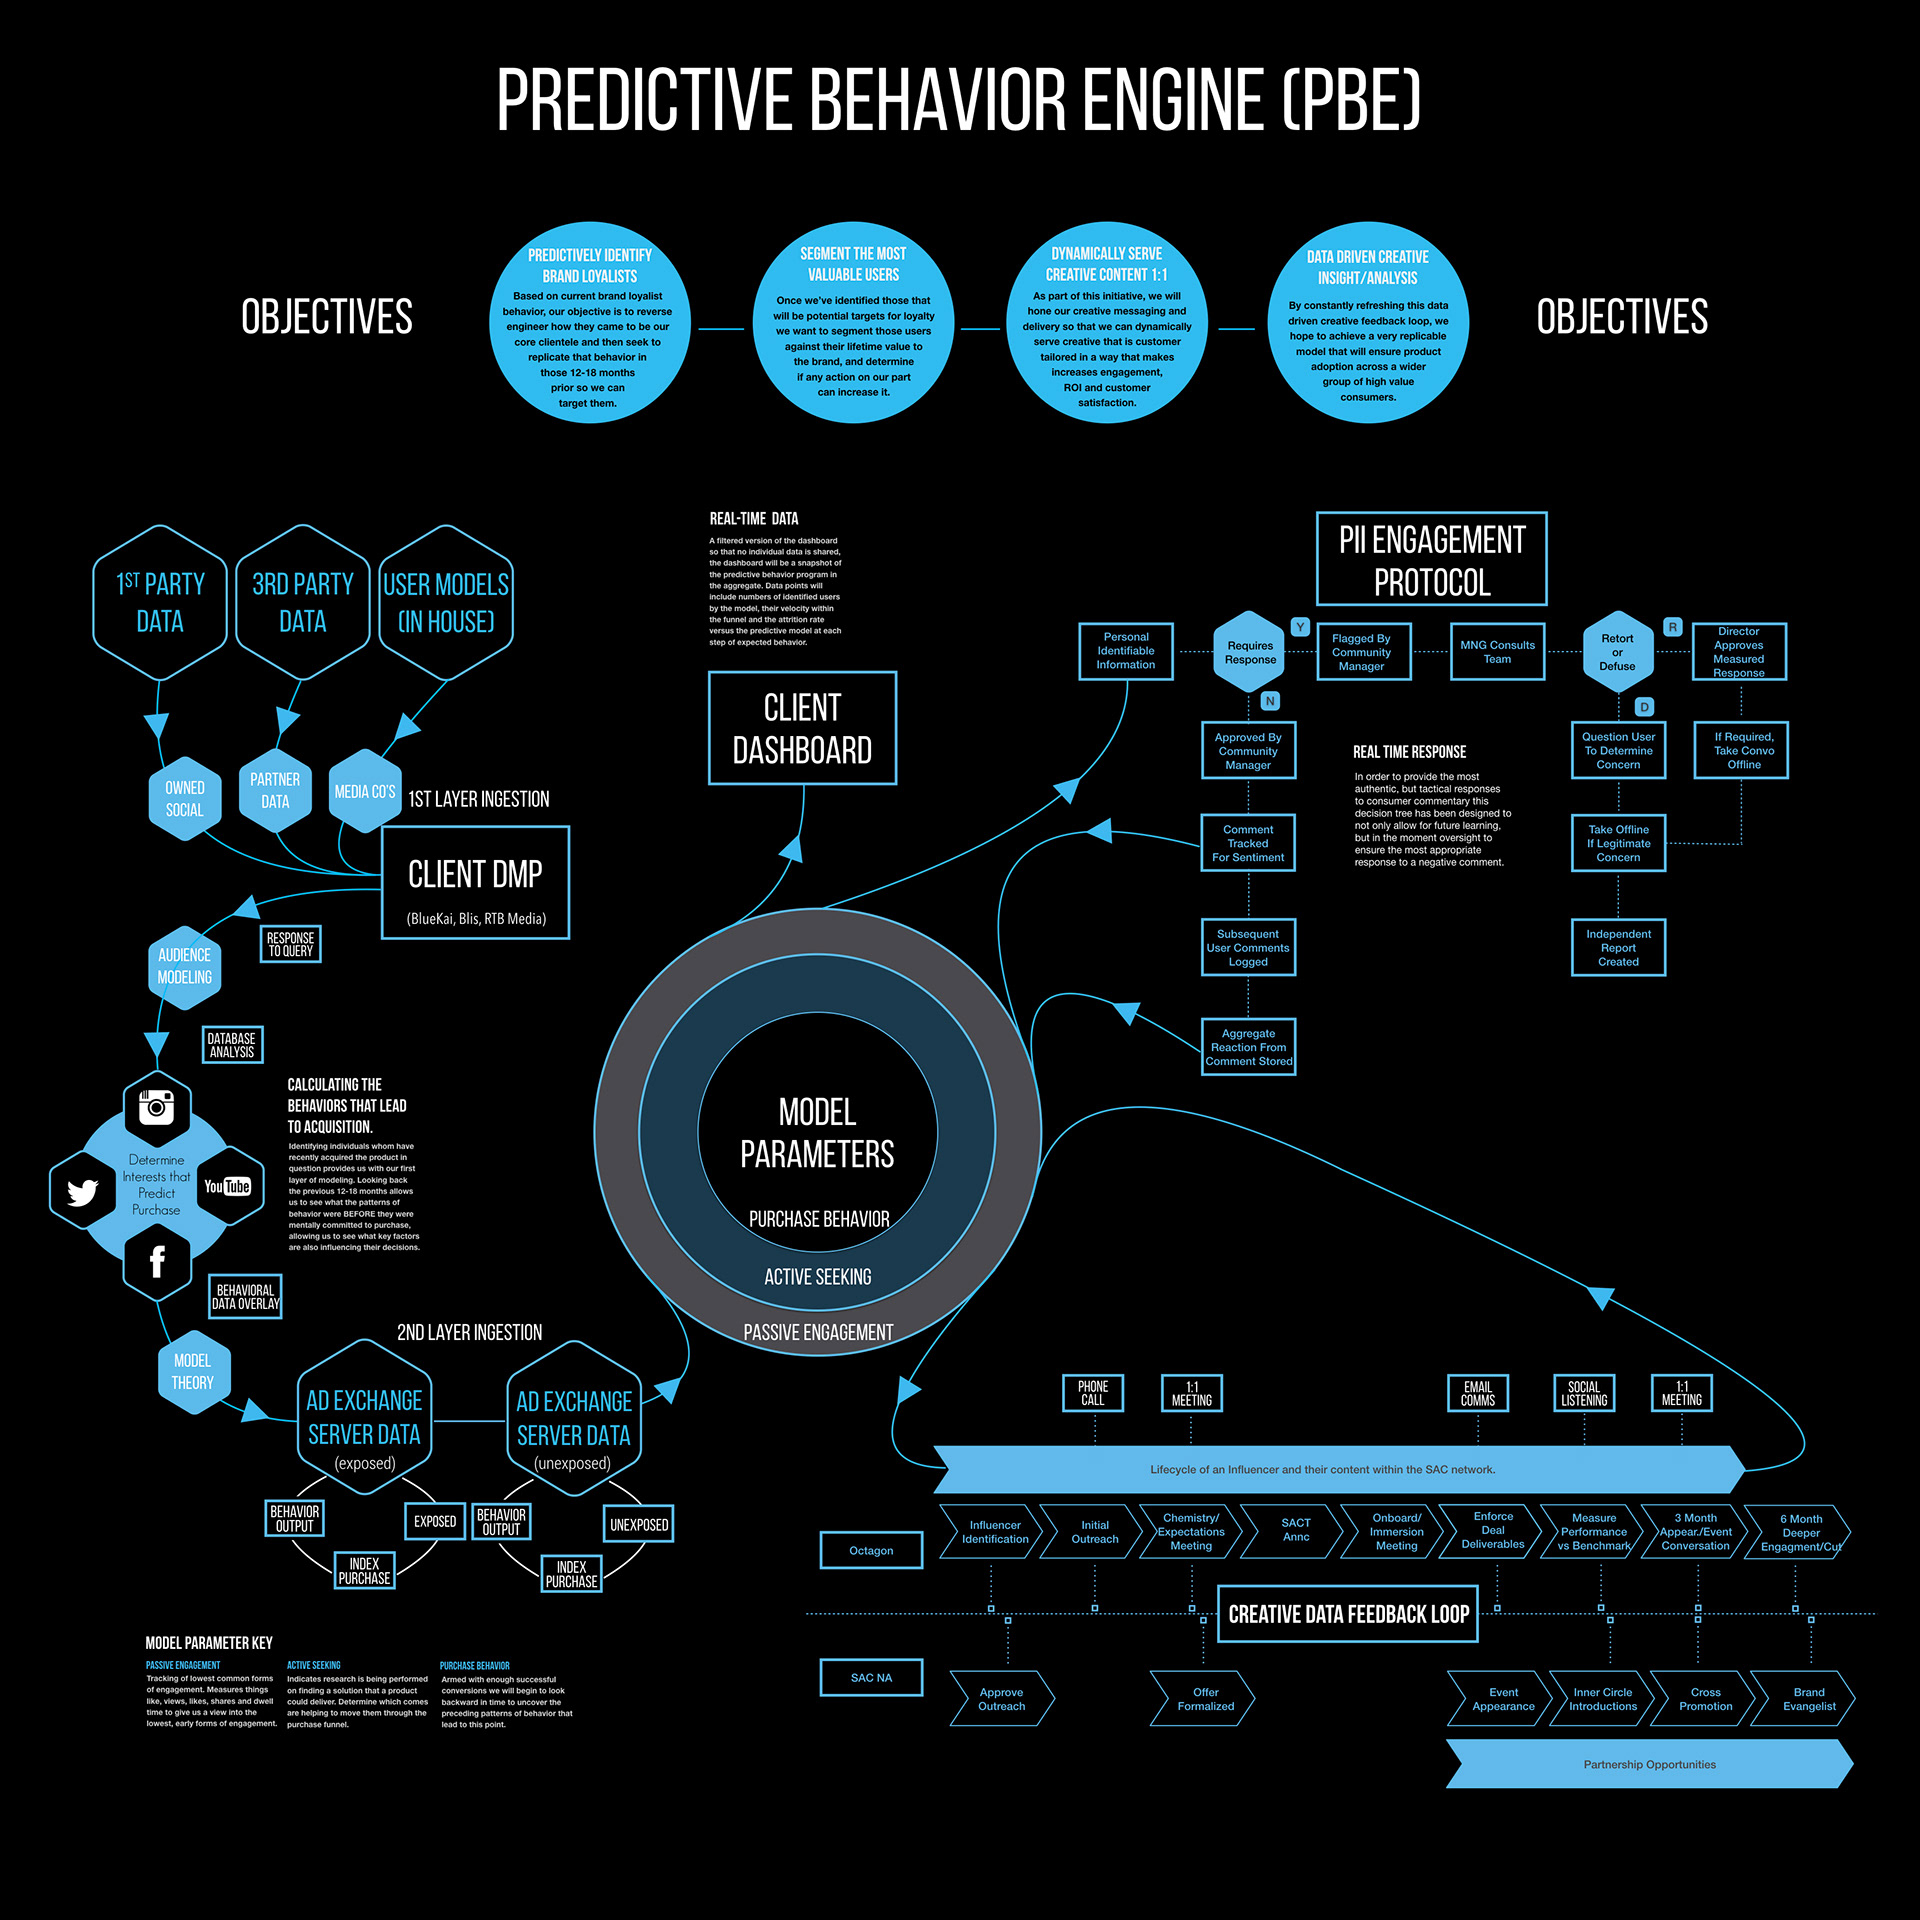
Created to illustrate the functional mechanics of a creative campaign, this model uses a combination of social graph data, programatic media and user behavior to predict purchase intent. The result was my client being able to not only predict new users, but actually bringing them into the purchase cycle on average 9 months earlier than they would have.
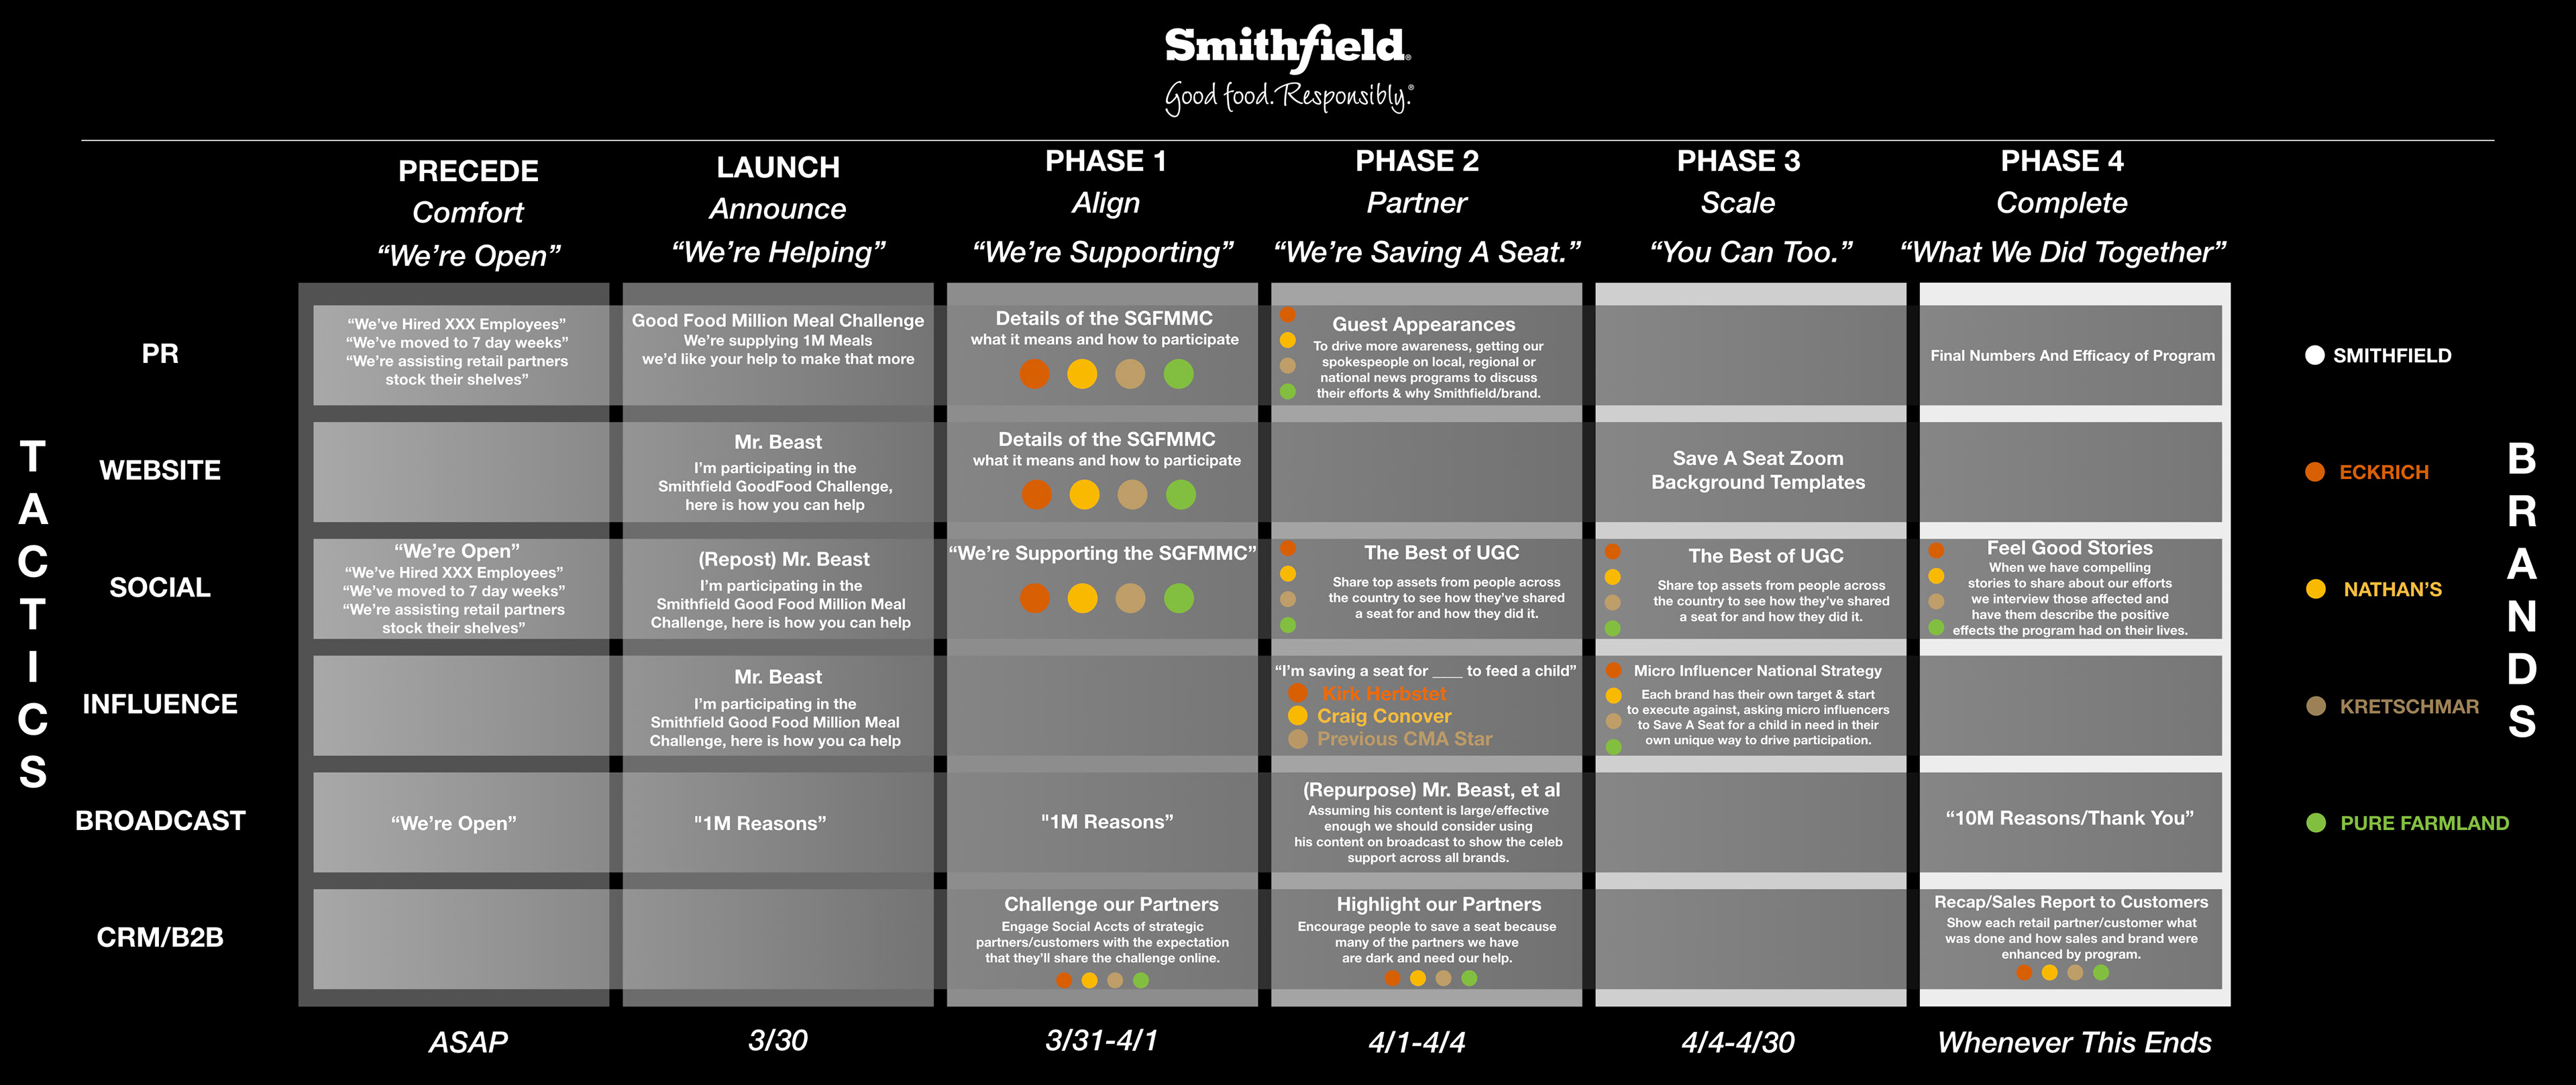
Model developed (in under two hours) to illustrate how to deploy a fully integrated media strategy for COVID-19 using existing assets. This program was specifically designed to illustrate the ways in which each Smithfield brand could demonstrate their support of the larger food service industry.
Pulled from a presentation I did on touchpoint planning to illustrate/support how our creative would best utilize the product's strategic messaging to align with the consumer's need state.